Project Case Database
The BENEFIT project case database constituted the basis of all analyses undertaken. It includes 86 cases comprising 55 PPPs and 31 public projects. Project-related information was systematically collected following the BENEFIT project case data collection protocol. Figures 1 and 2 present their distribution with respect to transport mode and country of implementation, respectively. Both delivery models are clearly differentiated through colour coding.

Figure 1: Distribution of BENEFIT Case studies per principle mode
 * One Project Shared with Denmark
Figure 2: Distribution of BENEFIT Project Case per country
However, the data that was needed to model these project cases based on the BENEFIT Matching Framework configuration was not always available. As a result, only 56 cases were employed in the various analyses streams that depended on the Matching Framework. The distribution of these project cases per country and mode is illustrated in Figures 3 and 4, respectively.
It is important to mention that project cases described in the BENEFIT Matching Framework format have multiple values of their respective sets of indicators which correspond to different times of their delivery life-cycle (termed “snapshots” in the BENEFIT project). On average, 3.5 snapshots were generated per project, which enabled the use of quantitative analysis methods
The sample selection process was based in principle on accessibility of information and leveraged project information captured in the COST Action TU1001 and OMEGA Centre project databases. Notably, all information collected for the BENEFIT project case database is in the public domain.
Road projects compose the greater part of the sample for both descriptive/qualitative analysis and Matching Framework analysis. This fact was taken into account when considering findings generated from the entire sample. Moreover, the project followed a multi-analysis approach. Findings were synthesised placing particular importance on the results of the qualitative analysis per mode, which was used to guide the interpretation of quantitative findings. Equally useful in this multi-analysis approach was the employment of fuzzy set Qualitative Comparative analysis, which holds the middle ground between qualitative and quantitative analysis.
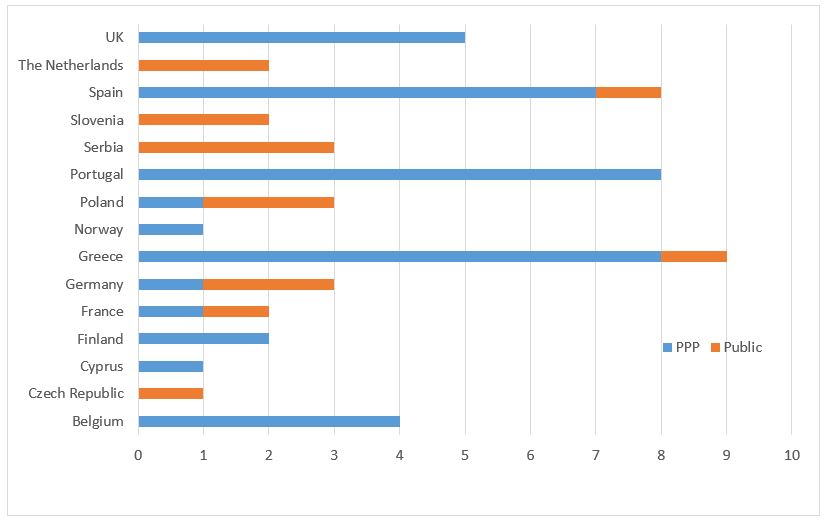
Figure 3: Distribution of Cases in Indicator Format per Country
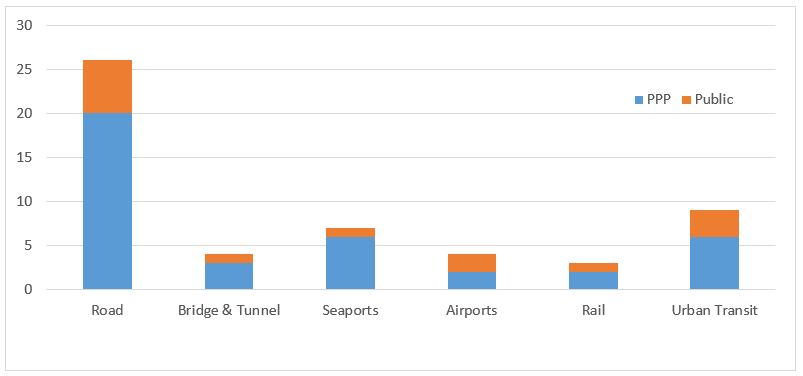
Figure 4: Distribution of Project Cases in Indicator Format per Mode
As can be seen from the above figures, some countries are over-represented in the sample. This was also taken into account in both qualitative and quantitative analyses.
Furthermore, the small number of project cases in certain mode categories limited the potential for a full analysis of the respective infrastructure modes.
Finally, while significant effort was placed on including projects financed purely by the public sector, this proved extremely difficult as the relevant information was not readily available. This limitation was intensified by the fact that the construction of publicly financed projects involves multiple contracts which were hard to trace.
In this context, the OMEGA Centre project database, initially endorsed for its expected contribution of publicly financed projects, could only be used for qualitative analysis as no additional information, which was necessary for quantitative analysis, could be collected on its projects.
Read More
COST Action TU 1001 Project Cases (2013)
COST Action TU 1001 Project Cases (2014)